

Data Analytics
Learn how to work with data, analyze information, and communicate insights that inform real decisions.

Upcoming Cohort
Mogadishu Lab & Online
What You'll Learn
From messy tables to a clear story: spreadsheets, SQL, Python, and charts you can present.
Spreadsheets to SQL
Clean, filter, and join data. Move from spreadsheet habits into queries you can reuse.
Python for Data Analysis
Load tables, compute summaries, and handle missing values with beginner-friendly Python.
Visualization & Storytelling
Choose the right chart and write the sentence that makes the insight usable.
Actionable Dashboards
Assemble a simple dashboard and a short readout for a decision-maker.
How the Program Works
Every week you work a real table, not a toy lecture.
Learn
Live walkthroughs of cleaning, querying, and charting with the cohort.
Practice
Lab time on datasets with mentor help when you get stuck.
Build
A weekly notebook or sheet that answers a defined question.
Share
Present one insight and take questions — the same way teams actually work.
Program Structure
Five hours a week, with a weekend lab for analysis sprints.
Data hygiene in spreadsheets
Types, filters, pivot tables, and common errors
Asking questions with SQL
SELECT, WHERE, GROUP BY, and simple joins
Python notebooks
Loading CSVs, summaries, and missing data
Analysis patterns
Comparisons, trends, and checking your own work
Charts that tell the truth
Visualization choices and a one-page insight write-up
Dashboard & demo
A simple dashboard and live readout for the cohort
Program Overview
Duration
6 Weeks · 5 hrs/week
Format
Online & Mogadishu Tech Lab
Schedule
2 live sessions/week
Mentorship
Small-group mentor review
Outcome
Dashboard + insight notebook
Who is This For?
- Somali girls and women who want to work with numbers, not just consume reports.
- Beginners comfortable with a computer who are ready to practice every week.
- People who prefer clear questions and evidence over vague dashboards.
- Students who can attend live labs and finish a short weekly analysis.
Don't just learn. Build.
Finish with a cleaned dataset, a notebook, and a dashboard you can talk through.
Cleaned dataset & query pack
A messy table turned into a reliable source, with the queries used to answer three defined questions.

Insight notebook
A short analysis with charts and a plain-language summary a non-analyst can use.
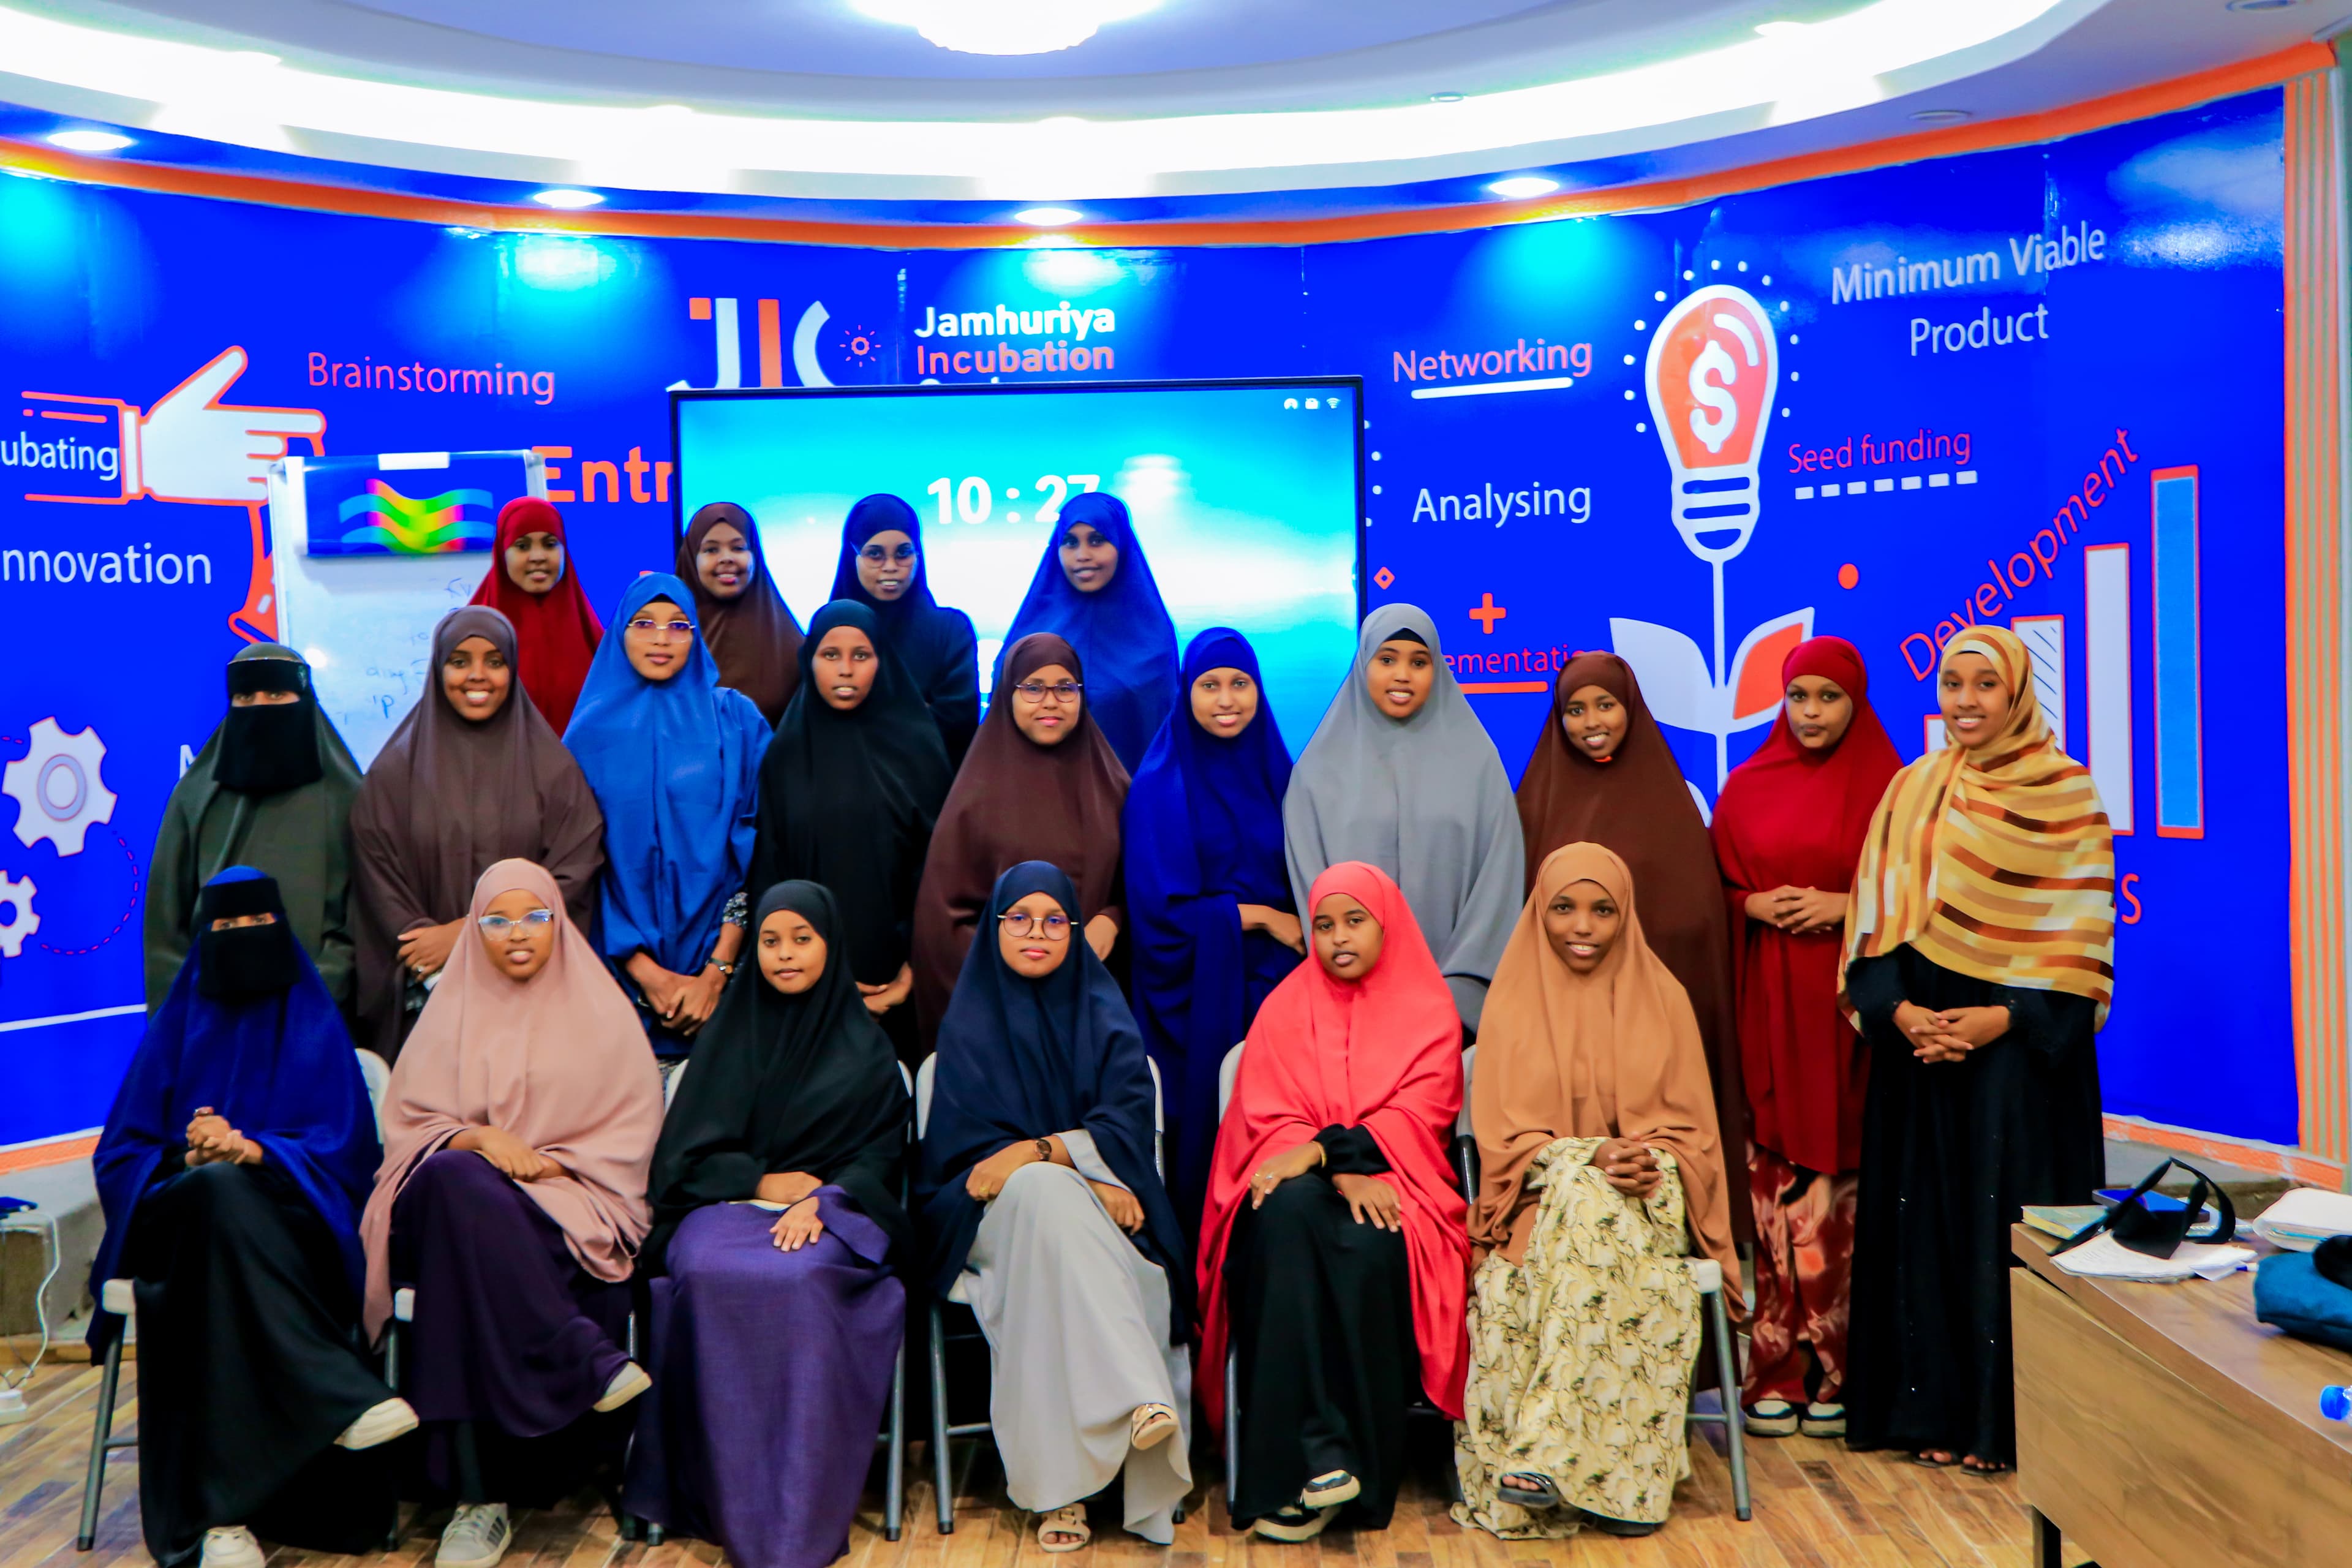
Decision dashboard
A simple dashboard and a five-minute readout of what to do next.